40.2. Quick introduction to scipy.stats#
The scipy.stats module contains a large number of probability distributions, summary and frequency statistics, correlation functions statistical tests, and more. If you google scipy.stats, you’ll likely get the manual page as the first hit: https://docs.scipy.org/doc/scipy/reference/stats.html. Here you’ll find a long list of the continuous and discrete distributions that are available for creating random variables, followed (scroll way down) by different methods (functions) to extract properties of a distribution (called Summary statistics) and to perform many other statistical tasks.
Follow the link for any of the distributions (your choice!) to find its mathematical definition, some examples of how to use it, and a list of methods. Some methods of particular interest are:
mean()- Mean of the distribution.median()- Median of the distribution.pdf(x)- Value of the probability density function at x.rvs(size=numpts)- generate numpts random values of the pdf.interval(alpha)- Endpoints of the range that contains alpha percent of the distribution.
Code example#
import scipy.stats as stats

# Define a normally distributed random variable with mean=1.0 and standard deviation = 2.0
my_norm_rv = stats.norm(loc=1.0, scale=2.0)

# Extract and print the mean and variance
print(f'The mean is {my_norm_rv.mean():3.1f}')
print(f'The variance is {my_norm_rv.var():3.1f}')

# The 68% credible interval (approximately one sigma)
(min68,max68) = my_norm_rv.interval(0.68)
print(f'The 68% credible interval is [{min68:4.2f},{max68:4.2f}]')

# Draw five random samples. Note that the last output will be printed.
my_norm_rv.rvs(size=5)
The mean is 1.0
The variance is 4.0
The 68% credible interval is [-0.99,2.99]
array([ 5.51444345, -2.13656082, 0.15331911, -0.92151022, 4.49815364])
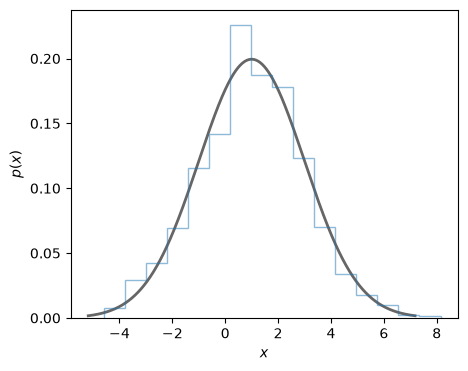
Create a plot to compare the line shape of the PDF with a histogram of a large number of samples from the PDF.
import matplotlib.pyplot as plt
import numpy as np
fig, ax = plt.subplots(nrows=1, ncols=1, **{"figsize":(5,4)})
x = np.linspace(my_norm_rv.ppf(0.001),
                my_norm_rv.ppf(0.999), 1000)
ax.plot(x, my_norm_rv.pdf(x),
       'k-', lw=2, alpha=0.6, label='pdf')
r = my_norm_rv.rvs(size=1000)
ax.hist(r, density=True, histtype='step', bins=16, alpha=0.5)
ax.set_xlabel(r'$x$')
ax.set_ylabel(r'$p(x)$');
(Pseudo) random number generator#
Random numbers generated by a computer are, in fact, not random at all. They are deterministically determined from a sequence of numbers that look random. The method to generate this sequence is known as a pseudo random number generator (PRNG), but will not be described here.
The scipy.stats module uses numpy functionality to generate random numbers and sample the distribution for a random variable. In fact, many of the standard distributions are built into numpy and if all you need is fast sampling of random numbers then you can often use numpy directly without the need for scipy.stats.
The lack of true randomness can be turned into a feature since it allows for experimentation, reproducibility and unit testing of code that uses stochastic modelling. The sequence of random numbers is determined by: (i) the choice of PRNG algorithm, and (ii) a seed to start the generation. Therefore, we can generate the same random numbers in two different runs by specifying the same PRNG and seed. In numpy the recommended procedure for random number sampling is to create a Generator instance with default_rng and call the relevant methods as attributes to this instance. In the code below, we illustrate this procedure to collect five samples from a standard normal distribution using both numpy and scipy.stats. You should get the same output if you run this code locally.
import numpy as np
import scipy.stats as stats
# seed number
seed=42
# Generator instance initialized with the seed
rng = np.random.default_rng(seed)
print(f'numpy samples from N(0,1) with {rng} and seed={seed}: ')
# Use numpy to collect samples from a standard normal
np_random_numbers = rng.normal(loc=0, scale=1, size=5)
print(np_random_numbers)

# The same with scipy.stats
# Create the random variable
my_norm_rv = stats.norm(loc=0.0, scale=1.0)
# sample, using the same PRNG and seed as before
rng = np.random.default_rng(seed)
print(f'scipy.stats samples from N(0,1) with {rng} and seed={seed}: ')
stats_random_numbers = my_norm_rv.rvs(size=5,random_state=rng)
print(stats_random_numbers)
numpy samples from N(0,1) with Generator(PCG64) and seed=42:
[ 0.30471708 -1.03998411  0.7504512   0.94056472 -1.95103519]
scipy.stats samples from N(0,1) with Generator(PCG64) and seed=42:
[ 0.30471708 -1.03998411  0.7504512   0.94056472 -1.95103519]