from myst_nb import glue

from dataclasses import dataclass
from typing import Callable, Optional

import numpy as np
import matplotlib.pyplot as plt
from matplotlib.patches import Rectangle
from scipy.integrate import quad
from scipy.stats import norm

plt.rcParams.update({
    'font.size': 16,           # Global default size
    'axes.titlesize': 20,      # Title of the individual plots
    'axes.labelsize': 18,      # x and y axis labels
    'xtick.labelsize': 14,     # x-axis tick labels
    'ytick.labelsize': 14,     # y-axis tick labels
    'legend.fontsize': 14,     # Legend font size
    'figure.titlesize': 22     # Main figure super-title
})

@dataclass
class BoxHistogram:
    edges: np.ndarray
    counts: np.ndarray
    target_bin_probabilities: np.ndarray
    normalization_on_range: float

    @property
    def n_bins(self) -> int:
        return len(self.counts)

    @property
    def n_boxes(self) -> int:
        return int(self.counts.sum())

    @property
    def bin_width(self) -> float:
        widths = np.diff(self.edges)

        if not np.allclose(widths, widths[0]):
            raise ValueError("The bins must have equal widths.")

        return float(widths[0])

    @property
    def box_height(self) -> float:
        """
        Since each box has area 1/n_boxes,

            bin_width * box_height = 1/n_boxes.
        """
        return 1.0 / (self.n_boxes * self.bin_width)

    @property
    def bin_probabilities(self) -> np.ndarray:
        return self.counts / self.n_boxes

    @property
    def density_heights(self) -> np.ndarray:
        return self.counts * self.box_height

    def probability(self, selected_bins: np.ndarray) -> float:
        """Probability contained in a Boolean selection of whole bins."""
        selected_bins = np.asarray(selected_bins, dtype=bool)

        if selected_bins.shape != self.counts.shape:
            raise ValueError(
                "selected_bins must contain one Boolean value per bin."
            )

        return float(
            self.counts[selected_bins].sum() / self.n_boxes
        )

    def intervals_from_mask(
        self,
        selected_bins: np.ndarray,
    ) -> list[tuple[float, float]]:
        """
        Convert a Boolean bin mask into one or more intervals.

        This is useful for highest-density regions, which may be disconnected.
        """
        selected_bins = np.asarray(selected_bins, dtype=bool)
        intervals = []

        i = 0
        while i < self.n_bins:
            if not selected_bins[i]:
                i += 1
                continue

            j = i
            while (
                j + 1 < self.n_bins
                and selected_bins[j + 1]
            ):
                j += 1

            intervals.append(
                (float(self.edges[i]), float(self.edges[j + 1]))
            )

            i = j + 1

        return intervals

    def plot(
        self,
        selected_bins: Optional[np.ndarray] = None,
        pdf: Optional[Callable[[float], float]] = None,
        ax=None,
        title: Optional[str] = None,
        intervals: Optional[str] = None,
    ):
        """
        Plot every equal-probability box separately.

        Parameters
        ----------
        selected_bins
            Boolean mask indicating which complete bars should be shaded.

        pdf
            Optional target PDF to overlay. It is normalized over the
            displayed x range.

        ax
            Optional matplotlib axis.
        """
        if ax is None:
            _, ax = plt.subplots(figsize=(10, 5))

        if selected_bins is None:
            selected_bins = np.zeros(self.n_bins, dtype=bool)
        else:
            selected_bins = np.asarray(selected_bins, dtype=bool)

        dx = self.bin_width
        dh = self.box_height

        for bin_index, number_of_boxes in enumerate(self.counts):
            for level in range(int(number_of_boxes)):
                rectangle = Rectangle(
                    xy=(
                        self.edges[bin_index],
                        level * dh,
                    ),
                    width=dx,
                    height=dh,
                    facecolor=(
                        "C0"
                        if selected_bins[bin_index]
                        else "white"
                    ),
                    edgecolor="black",
                    linewidth=0.55,
                )

                ax.add_patch(rectangle)

        ax.set_xlim(self.edges[0], self.edges[-1])

        ymax = max(self.density_heights.max(), dh)
        ax.set_ylim(0.0, 1.08 * ymax)

        ax.set_xlabel(r"$x$")
        ax.set_ylabel("probability density")
        ax.set_title(
            title or
            f"{self.n_boxes} equal-probability boxes"
        )
        if intervals:
           answer_text = "intervals = \n" + str(intervals)
           ax.text(
              0.02, 0.97,                      # Coordinates (2% from left, 97% from bottom)
              answer_text,     # The text string
              transform=ax.transAxes,          # Use axes coordinate system (0 to 1)
              verticalalignment='top',         # Align the top of the text to the coordinate
              horizontalalignment='left'       # Align the left of the text to the coordinate
           )

        ax.grid(axis="y", alpha=0.2)

        if pdf is not None:
            x_plot = np.linspace(
                self.edges[0],
                self.edges[-1],
                1200,
            )

            y_plot = np.array(
                [pdf(x) for x in x_plot],
                dtype=float,
            )

            # Normalize the target curve on the displayed range.
            y_plot /= self.normalization_on_range

            ax.plot(
                x_plot,
                y_plot,
                linewidth=2,
                label="target density",
            )
            ax.legend()

        return ax


def make_box_histogram(
    pdf: Callable[[float], float],
    x_range: tuple[float, float],
    n_bins: int = 40,
    n_boxes: int = 200,
) -> BoxHistogram:
    """
    Approximate a PDF using an integer number of equal-area boxes.

    The target PDF is integrated over each equal-width bin. Integer
    box counts are assigned by the largest-remainder method, so that

        sum(counts) == n_boxes

    exactly.

    The PDF is renormalized over x_range.
    """
    xmin, xmax = x_range

    if xmax <= xmin:
        raise ValueError("x_range must satisfy xmax > xmin.")

    if n_bins < 1 or n_boxes < 1:
        raise ValueError("n_bins and n_boxes must be positive.")

    edges = np.linspace(xmin, xmax, n_bins + 1)

    # Integrate the target density over each bin.
    bin_masses = np.array(
        [
            quad(
                pdf,
                edges[i],
                edges[i + 1],
                limit=200,
            )[0]
            for i in range(n_bins)
        ],
        dtype=float,
    )

    if np.any(bin_masses < -1.0e-12):
        raise ValueError(
            "The supplied PDF is negative in at least one bin."
        )

    # Remove insignificant negative roundoff.
    bin_masses = np.maximum(bin_masses, 0.0)

    normalization = float(bin_masses.sum())

    if not np.isfinite(normalization) or normalization <= 0.0:
        raise ValueError(
            "The PDF has no finite positive mass on x_range."
        )

    bin_probabilities = bin_masses / normalization

    # Desired, generally noninteger, box counts.
    raw_counts = n_boxes * bin_probabilities

    # Begin by rounding down.
    counts = np.floor(raw_counts).astype(int)

    # Distribute remaining boxes according to the largest
    # fractional remainders.
    boxes_left = n_boxes - counts.sum()

    if boxes_left > 0:
        fractional_parts = raw_counts - counts

        recipients = np.argsort(
            fractional_parts
        )[::-1][:boxes_left]

        counts[recipients] += 1

    return BoxHistogram(
        edges=edges,
        counts=counts,
        target_bin_probabilities=bin_probabilities,
        normalization_on_range=normalization,
    )


def equal_tailed_bins(
    hist: BoxHistogram,
    level: float = 0.68,
) -> np.ndarray:
    """
    Equal-tailed interval, rounded outward to whole bins.
    """
    if not 0.0 < level < 1.0:
        raise ValueError("level must be between zero and one.")

    tail_probability = 0.5 * (1.0 - level)
    cdf = np.cumsum(hist.counts) / hist.n_boxes

    first_bin = int(
        np.searchsorted(
            cdf,
            tail_probability,
            side="left",
        )
    )

    last_bin = int(
        np.searchsorted(
            cdf,
            1.0 - tail_probability,
            side="left",
        )
    )

    mask = np.zeros(hist.n_bins, dtype=bool)
    mask[first_bin:last_bin + 1] = True

    return mask


def shortest_contiguous_bins(
    hist: BoxHistogram,
    level: float = 0.68,
) -> np.ndarray:
    """
    Narrowest contiguous set of whole bins containing at least
    the requested probability.
    """
    if not 0.0 < level < 1.0:
        raise ValueError("level must be between zero and one.")

    boxes_required = int(
        np.ceil(level * hist.n_boxes)
    )

    cumulative_counts = np.concatenate(
        ([0], np.cumsum(hist.counts))
    )

    best_candidate = None
    right = 0

    for left in range(hist.n_bins):
        right = max(right, left + 1)

        while (
            right <= hist.n_bins
            and cumulative_counts[right]
            - cumulative_counts[left]
            < boxes_required
        ):
            right += 1

        if right > hist.n_bins:
            break

        width = hist.edges[right] - hist.edges[left]

        excess_boxes = (
            cumulative_counts[right]
            - cumulative_counts[left]
            - boxes_required
        )

        candidate = (
            width,
            excess_boxes,
            left,
            right,
        )

        if (
            best_candidate is None
            or candidate < best_candidate
        ):
            best_candidate = candidate

    if best_candidate is None:
        raise RuntimeError(
            "No contiguous interval could be constructed."
        )

    _, _, left, right = best_candidate

    mask = np.zeros(hist.n_bins, dtype=bool)
    mask[left:right] = True

    return mask


def highest_density_bins(
    hist: BoxHistogram,
    level: float = 0.68,
) -> np.ndarray:
    """
    Highest-density set of whole bins.

    Because the bins have equal widths, sorting by histogram
    density is equivalent to sorting by the number of boxes
    in each bar.

    The resulting credible region may be disconnected.
    """
    if not 0.0 < level < 1.0:
        raise ValueError("level must be between zero and one.")

    boxes_required = int(
        np.ceil(level * hist.n_boxes)
    )

    # Tallest bars first.
    order = np.argsort(hist.counts)[::-1]

    mask = np.zeros(hist.n_bins, dtype=bool)
    accumulated_boxes = 0

    for bin_index in order:
        if accumulated_boxes >= boxes_required:
            break

        if hist.counts[bin_index] == 0:
            break

        mask[bin_index] = True
        accumulated_boxes += int(hist.counts[bin_index])

    return mask


##################################################################
#   Boxed pdf #1
##################################################################

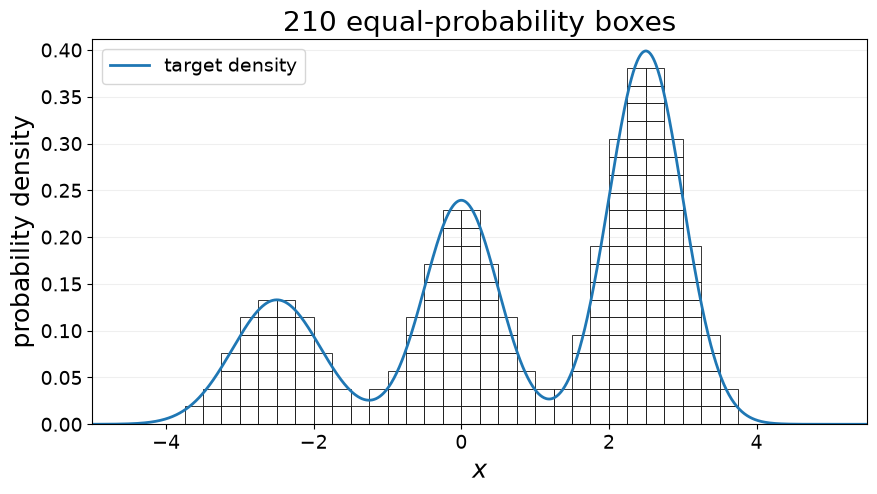
weights = np.array([0.42, 0.33, 0.25])
means = np.array([-2.4, 0.3, 2.8])
#standard_deviations = np.array([0.65, 0.35, 0.85])
standard_deviations = np.array([0.65, 0.35, 0.80])


def target_pdf(x):
    return np.sum(
        weights
        * norm.pdf(
            x,
            loc=means,
            scale=standard_deviations,
        )
    )


hist = make_box_histogram(
    pdf=target_pdf,
    x_range=(-5.0, 5.5),
    n_bins=42,
    n_boxes=210,
)


ax = hist.plot(pdf=target_pdf)
fig = ax.figure

# Save the rendered figure for insertion elsewhere.
glue("cred-int-figure-1", fig, display=False)

# Avoid displaying the figure at the original code-cell location.
plt.close(fig)

#print("Boxes in each bar:")
#print(hist.counts)
#print(f"\nProbability per box = {1 / hist.n_boxes:.5f}")

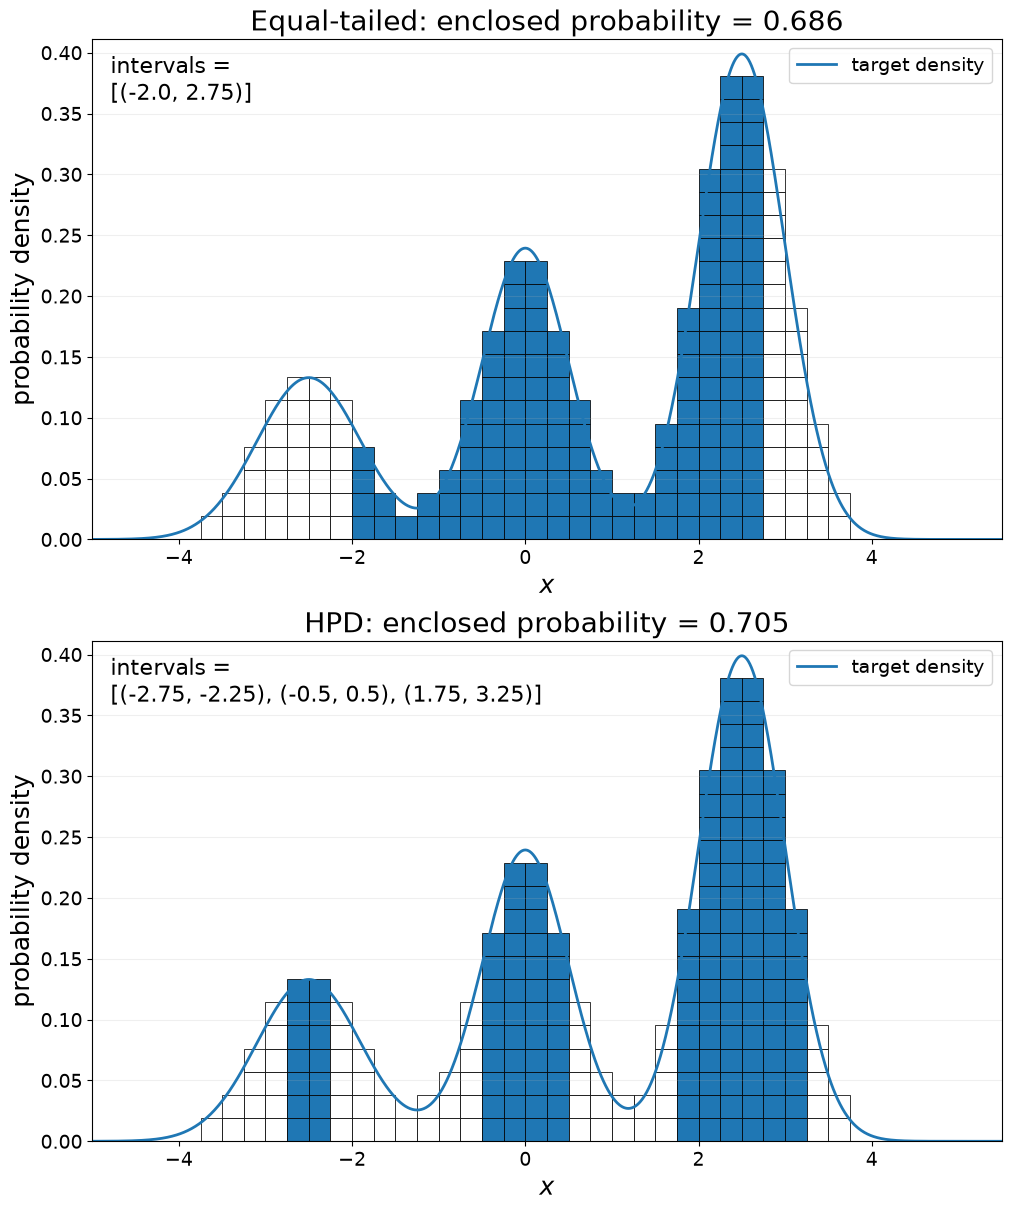
level = 0.68

prescriptions = {
    "Equal-tailed":
        equal_tailed_bins(hist, level),

   # "Shortest contiguous":
   #     shortest_contiguous_bins(hist, level),

    "HPD":
        highest_density_bins(hist, level),
}


fig, axes = plt.subplots(
    2,
    1,
    figsize=(10, 12),
    constrained_layout=True,
)

for ax, (name, selected_bins) in zip(
    axes,
    prescriptions.items(),
):
    enclosed_probability = hist.probability(
        selected_bins
    )

    intervals = hist.intervals_from_mask(
        selected_bins
    )

    hist.plot(
        selected_bins=selected_bins,
        pdf=target_pdf,
        ax=ax,
        title=(
            f"{name}: "
            f"enclosed probability "
            f"= {enclosed_probability:.3f}"
        ),
        intervals=intervals,
    )


#    print(
#        f"{name:22s}: "
#        f"{intervals}; "
#        f"probability = {enclosed_probability:.3f}"
#    )
#    answers = f"{name:22s}: {intervals}; probability = {enclosed_probability:.3f}"
#    answers = f"{name:22s}: {intervals}"
#    glue("cred-int-1ans", answers, display=False)


# Save the rendered figure for insertion elsewhere.
glue("cred-int-figure-1ans", fig, display=False)

# Avoid displaying the figure at the original code-cell location.
plt.close(fig)

#plt.show()


##################################################################
#   Boxed pdf #2
##################################################################

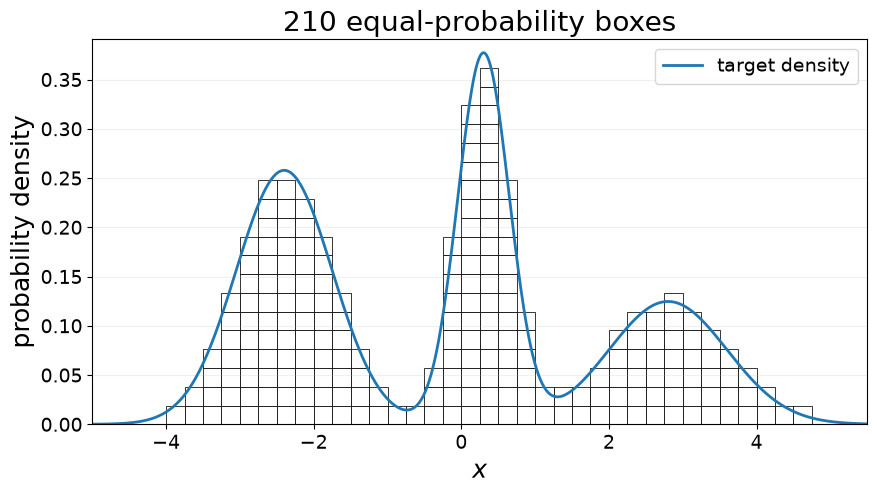
weights = np.array([0.20, 0.30, 0.50])
means = np.array([-2.5, 0.0, 2.5])
standard_deviations = np.array([0.6, 0.5, 0.5])


def target_pdf(x):
    return np.sum(
        weights
        * norm.pdf(
            x,
            loc=means,
            scale=standard_deviations,
        )
    )


hist = make_box_histogram(
    pdf=target_pdf,
    x_range=(-5.0, 5.5),
    n_bins=42,
    n_boxes=210,
)

ax = hist.plot(pdf=target_pdf)
fig = ax.figure

# Save the rendered figure for insertion elsewhere.
glue("cred-int-figure-2", fig, display=False)

# Avoid displaying the figure at the original code-cell location.
plt.close(fig)

#print("Boxes in each bar:")
#print(hist.counts)
#print(f"\nProbability per box = {1 / hist.n_boxes:.5f}")

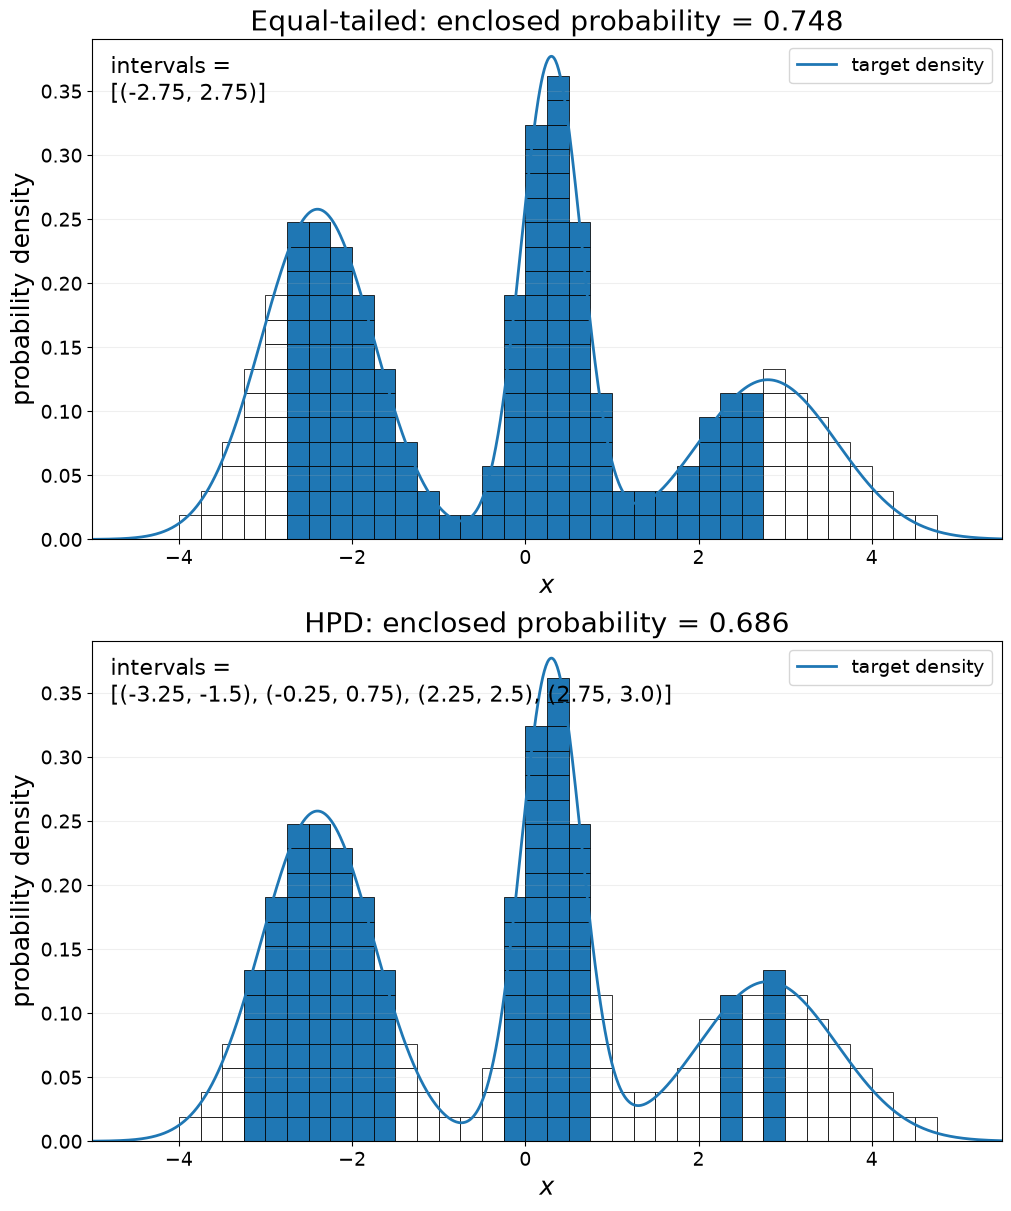
level = 0.68

prescriptions = {
    "Equal-tailed":
        equal_tailed_bins(hist, level),

   # "Shortest contiguous":
   #     shortest_contiguous_bins(hist, level),

    "HPD":
        highest_density_bins(hist, level),
}


fig, axes = plt.subplots(
    2,
    1,
    figsize=(10, 12),
    constrained_layout=True,
)

for ax, (name, selected_bins) in zip(
    axes,
    prescriptions.items(),
):
    enclosed_probability = hist.probability(
        selected_bins
    )

    intervals = hist.intervals_from_mask(
        selected_bins
    )

    hist.plot(
        selected_bins=selected_bins,
        pdf=target_pdf,
        ax=ax,
        title=(
            f"{name}: "
            f"enclosed probability "
            f"= {enclosed_probability:.3f}"
        ),
        intervals=intervals,
    )

    #print(
    #    f"{name:22s}: "
    #    f"{intervals}; "
    #    f"probability = {enclosed_probability:.3f}"
    #)
#    answers = f"{name:22s}: {intervals}; probability = {enclosed_probability:.3f}"
#    answers = f"{name:22s}: {intervals}"
#    glue("cred-int-2ans", answers, display=False)

# Save the rendered figure for insertion elsewhere.
glue("cred-int-figure-2ans", fig, display=False)

# Avoid displaying the figure at the original code-cell location.
plt.close(fig)

#plt.show()